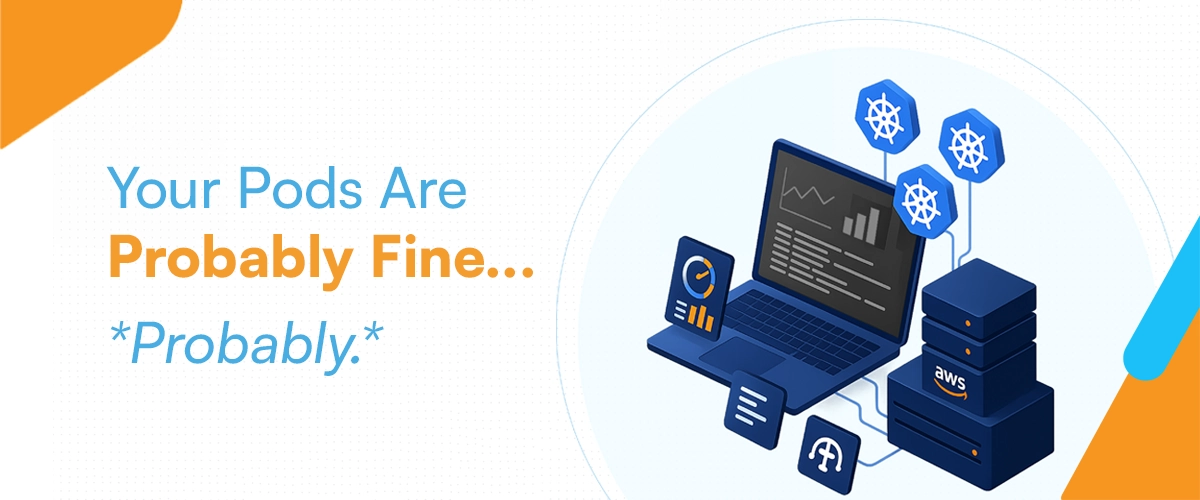
Modern applications deployed on Kubernetes—particularly on Amazon Elastic Kubernetes Service (EKS)—are dynamic, distributed, and highly scalable. While this flexibility drives innovation, it also introduces significant operational complexity.
Pods may scale rapidly, microservices communicate across multiple namespaces, and workloads shift dynamically across nodes. In such an environment, observability is not optional; it is essential.
It enables teams to:
● Detect and resolve issues before they impact end users.
● Understand application and cluster performance trends.
● Optimize workloads for reliability and efficiency.
A robust observability strategy ensures that operational teams move beyond reactive troubleshooting to proactive performance optimization.
Pillars of Observability in EKS:
Effective observability in Kubernetes revolves around three interconnected pillars:
A. Metrics
Quantitative performance indicators—such as CPU usage, memory consumption, request latency, and throughput—help assess workload health and performance over time.
B. Logs
Detailed, timestamped records of events generated by applications and Kubernetes system components. Logs are essential for root cause analysis, debugging, and compliance auditing.
C. Distributed Tracing
Tracing follows a request’s journey across multiple microservices, revealing dependencies, latency sources, and bottlenecks. This is particularly valuable for complex service meshes and high-traffic applications.
In EKS, these pillars can be addressed through a combination of AWS-native services (e.g., CloudWatch Container Insights) and open-source tools (e.g., Prometheus, Grafana, Jaeger).
Setting Up Prometheus and Grafana for Cluster Monitoring
Prometheus and Grafana remain the most widely adopted open-source stack for Kubernetes observability.
Implementation Steps:
1. Deploy Prometheus via the Prometheus Operator or Helm charts designed for EKS clusters.
2. Configure ServiceMonitors to scrape metrics from nodes, pods, and Kubernetes services.
3. Install Grafana and connect it to Prometheus as a data source.
4. Import Kubernetes Dashboards for real-time and historical insights.
5. Define Alert Rules in Prometheus or Grafana to notify teams of anomalies—such as excessive pod restarts, high CPU/memory utilization, or elevated request latency.
This setup provides granular insights and allows for highly customizable dashboards tailored to specific operational needs.
Using AWS CloudWatch for EKS Log Aggregation
Amazon CloudWatch is the native AWS service for collecting, analyzing, and alerting on log and metric data.
Best Practices for EKS Integration:
● Enable Container Insights to automatically gather performance metrics and container-level data.
● Deploy Fluent Bit as a DaemonSet to forward application and system logs to CloudWatch Logs.
● Use CloudWatch Logs Insights for fast, SQL-like querying of large log datasets.
● Configure CloudWatch Alarms to trigger notifications or automated remediation when thresholds are breached.
By combining CloudWatch with Prometheus/Grafana, organizations can leverage the scalability of AWS-native tools alongside the flexibility of open-source visualization.
Streamlining Observability with CloudLaunchpad
CloudLaunchpad offers a streamlined approach to Kubernetes and EKS deployments by integrating observability into the provisioning process.
Key Advantages:
● Automated Monitoring Stack Deployment: Installs and configures Prometheus, Grafana, and CloudWatch integration without manual setup.
● Pre-Built Dashboards and Alerts: Delivers ready-to-use visualization panels and performance alerts for immediate value.
● Consistency Across Environments: Ensures dev, staging, and production clusters follow the same observability best practices.
● Reduced Deployment Time: Achieves up to a 70% reduction in cluster setup time, enabling teams to focus on innovation rather than infrastructure configuration.
With Cloud Launchpad, observability becomes a default part of the cluster lifecycle, rather than an afterthought.
Conclusion: From Monitoring to Optimization
Implementing observability in AWS EKS is not merely about collecting data—it’s about gaining actionable insights that lead to measurable performance improvements.
By:
● Leveraging Prometheus and Grafana for flexible, detailed monitoring.
● Utilizing AWS CloudWatch for scalable log aggregation and alerting.
● Automating setup through Cloud Launchpad for speed and consistency.
This shift not only enhances reliability but also improves end-user experience, reduces operational costs, and fosters greater confidence in production deployments.
Footer
